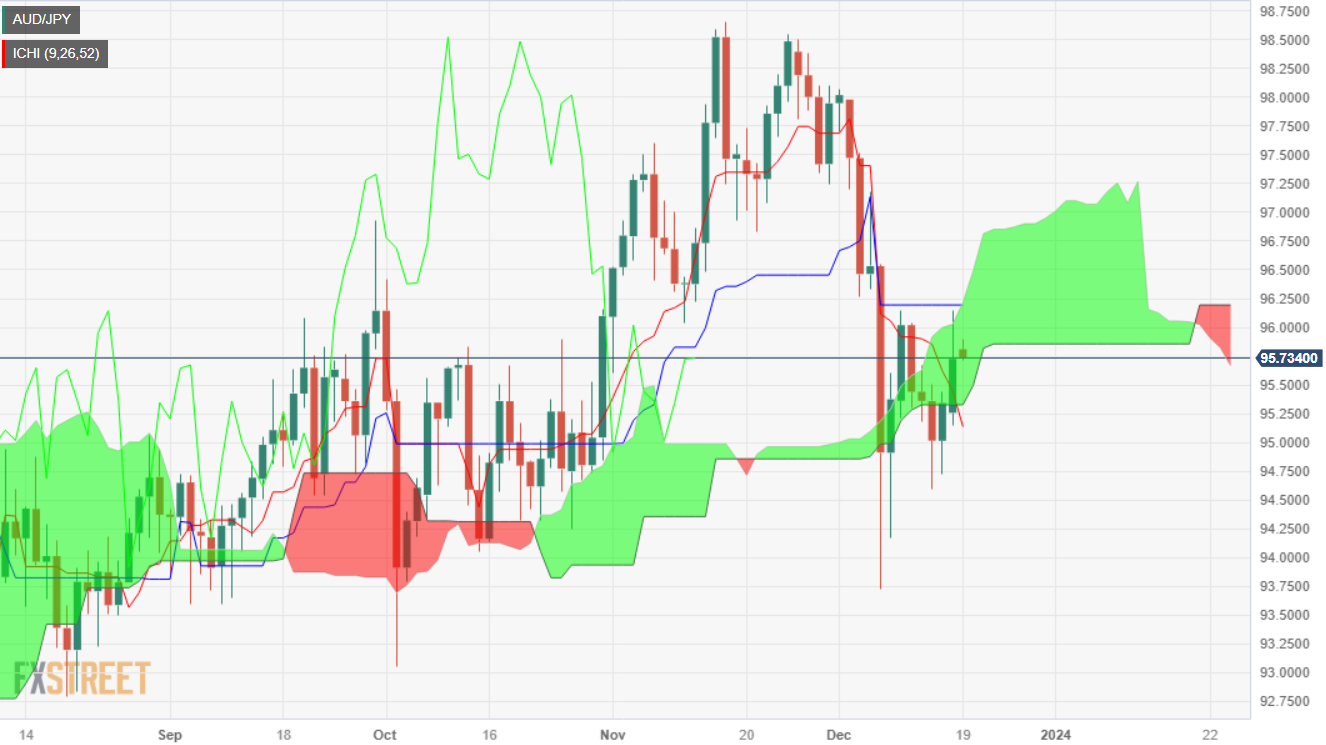
- AUD/JPY reclaimed the bottom of the Kumo, opening the door for a bullish reversal.
- Further upside is seen above the 96.00 mark, with key resistance at a confluence around 96.14.
- A drop below the Kumo, to pave the way for testing 93.00.
The AUD/JPY registered solid gains of 0.55% on Monday, taking advantage of a scarce appetite for safe-haven assets, with speculators eyeing central bank rate cuts for the next year. Nevertheless, the Bank of Japan (BoJ) is the only outlier and is expected to keep rates unchanged on Tuesday. At the time of writing, the pair is trading at 95.72, virtually unchanged, as Tuesday’s Asian session begins.
The BoJ is expected to hold rates below zero even though Governor Kazuo Ueda suggested that at a certain point, negative interest rates would end, rocking the boat, sending most Japanese Yen (JPY) crosses plunging, as the JPY appreciated sharply against most G7 currencies.
Given the fundamental backdrop, the AUD/JPY has recovered some ground, with the pair breaking the bottom of the Ichimoku Cloud (Kumo), a resistance area at around 95.32, opening the door to test the 96.00 figure. A clear break could pave the way towards the confluence of the Kijun-Sen and the Senkou Span B at 96.14. Further upside is seen, once cleared, with the 96.82 November 21 low up next, followed by the 97.00 figure.
Nevertheless, buyers lacked the strength, and the pair retraced somewhat toward the bottom of the Kumo. But a second failure, at around 96.00, could pave the way to drop below the Kumo and extend its losses toward the latest cycle low of 93.70.
AUD/JPY Price Analysis – Daily Chart

AUD/JPY Key Technical Levels
AUD/JPY
| OVERVIEW | |
|---|---|
| Today last price | 95.76 |
| Today Daily Change | 0.42 |
| Today Daily Change % | 0.44 |
| Today daily open | 95.34 |
| TRENDS | |
|---|---|
| Daily SMA20 | 96.83 |
| Daily SMA50 | 96.29 |
| Daily SMA100 | 95.38 |
| Daily SMA200 | 93.67 |
| LEVELS | |
|---|---|
| Previous Daily High | 95.44 |
| Previous Daily Low | 94.72 |
| Previous Weekly High | 96.15 |
| Previous Weekly Low | 94.6 |
| Previous Monthly High | 98.66 |
| Previous Monthly Low | 95.61 |
| Daily Fibonacci 38.2% | 95.17 |
| Daily Fibonacci 61.8% | 95 |
| Daily Pivot Point S1 | 94.9 |
| Daily Pivot Point S2 | 94.45 |
| Daily Pivot Point S3 | 94.18 |
| Daily Pivot Point R1 | 95.62 |
| Daily Pivot Point R2 | 95.89 |
| Daily Pivot Point R3 | 96.34 |

