Bitcoin (BTC $41,356) may have more to lose if one BTC price chart pattern plays out as usual, warns veteran analyst Filbfilb.
In his latest update on X (formerly Twitter) on Jan. 19, the founder of trading suite DecenTrader sounded the alarm over Bitcoin’s descent to monthly lows.
Bitcoin’s three-day chart suggests start of downside
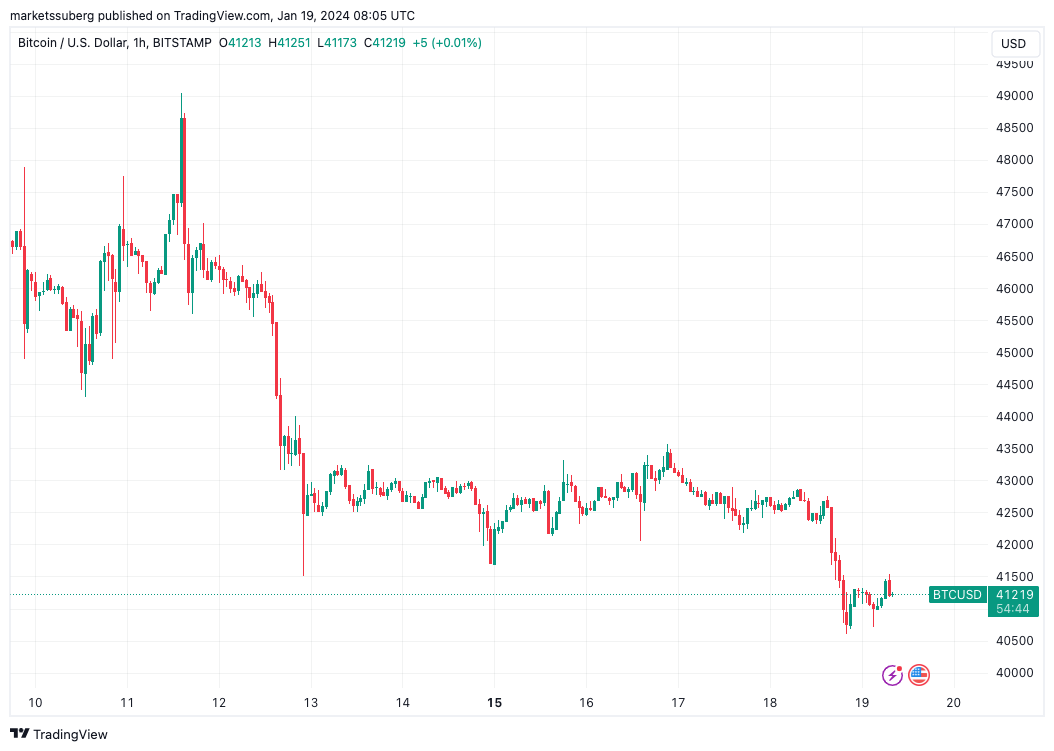
BTC price action fell to $40,600 overnight, marking almost a 20% retreat from last week’s local highs, data from Cointelegraph Markets Pro and TradingView confirms.

BTC/USD 1-hour chart. Source: TradingView
While subsequently rebounding above $41,000, market strength is convincing few traders and analysts in the short term.
Filbfilb is among them, with three-day timeframes of particular concern.
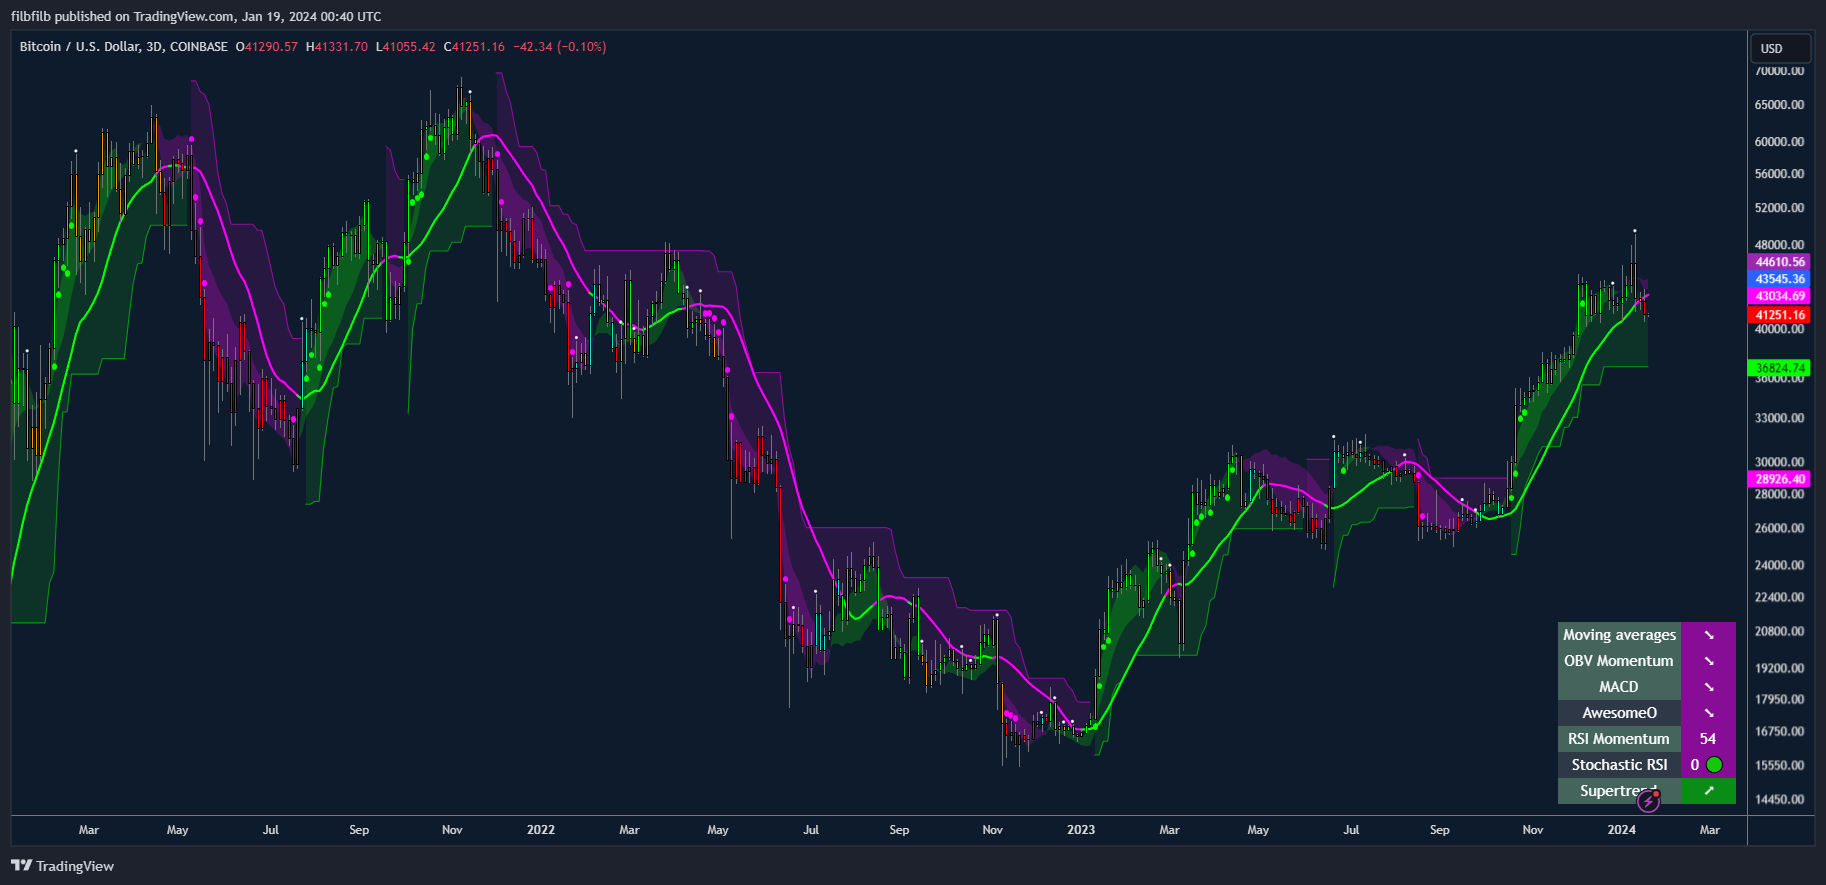
Uploading a comparative chart, he showed that when the three-day chart crosses below the daily 50-period simple moving average (DMA), further downside tends to result. The chart extended to Bitcoin’s current all-time high of $69,000, seen in November 2021.
“3 Day red with a break below 50 DMA. There are a few examples of this happening in the past,” he commented.

BTC/USD 3-day chart with 50-day SMA. Source: Filbfilb/TradingView
Previously, Filbfilb successfully estimated Bitcoin topping out at $48,000 around the announcement of the approval of United States-based spot Bitcoin exchange-traded funds (ETFs). A similar BTC price target is in place for April’s block subsidy halving.
Bitcoin traders stay cautious
Meanwhile, the overnight dip sent BTC/USD below its 2024 opening price.
Analyzing liquidity conditions, financial commentator Tedtalksmacro flagged $40,000 as the next crucial level to hold.
As Cointelegraph reported, various market participants view the mid-$30,000 range as a potential bounce zone to come.
“I think we need 1 more (smaller) leg down before we can bounce. Last nights bounce not convincing me…,” popular trader Crypto Ed, creator of trading group CryptoTA, wrote on the day, preceding in-depth analysis.

