
Oil prices navigate a complex landscape with geopolitical tensions and OPEC’s cohesion at stake, impacting commodities like USOIL, UKOIL, and Natural Gas.

Key Insights
- Oil prices see second weekly gain despite Red Sea vessel attacks and Angola’s OPEC exit.
- Natural Gas shows cautious optimism, with NG slightly above pivot point at $2.44.
- USOIL faces bearish sentiment below pivot point at $74.96.
- UKOIL trends bearish below $80 amid market volatility.
- Weaker U.S. dollar and cooling inflation support oil prices.
Oil prices ended lower yet achieved a second consecutive weekly gain amidst a volatile week. Supply concerns escalated due to attacks on vessels in the Red Sea by the Iran-aligned Yemeni Houthi group, raising the prospect of delivery delays through the Suez Canal.
Angola’s departure from OPEC raised doubts about the group’s unity and future production cuts, although Angola’s contribution is relatively minor compared to the group’s total output. Supporting oil prices, the U.S. dollar weakened to five-month lows as inflation cooled, hinting at possible aggressive rate cuts next year.
Meanwhile, the U.S. rig count reported by Baker Hughes indicated a slight decrease, suggesting a moderation in the record pace of crude output. This complex scenario impacts commodities like USOIL, UKOIL, and Natural Gas, highlighting the interconnectedness of geopolitical events, currency fluctuations, and energy market dynamics.
Natural Gas Price Forecast
Natural Gas Chart
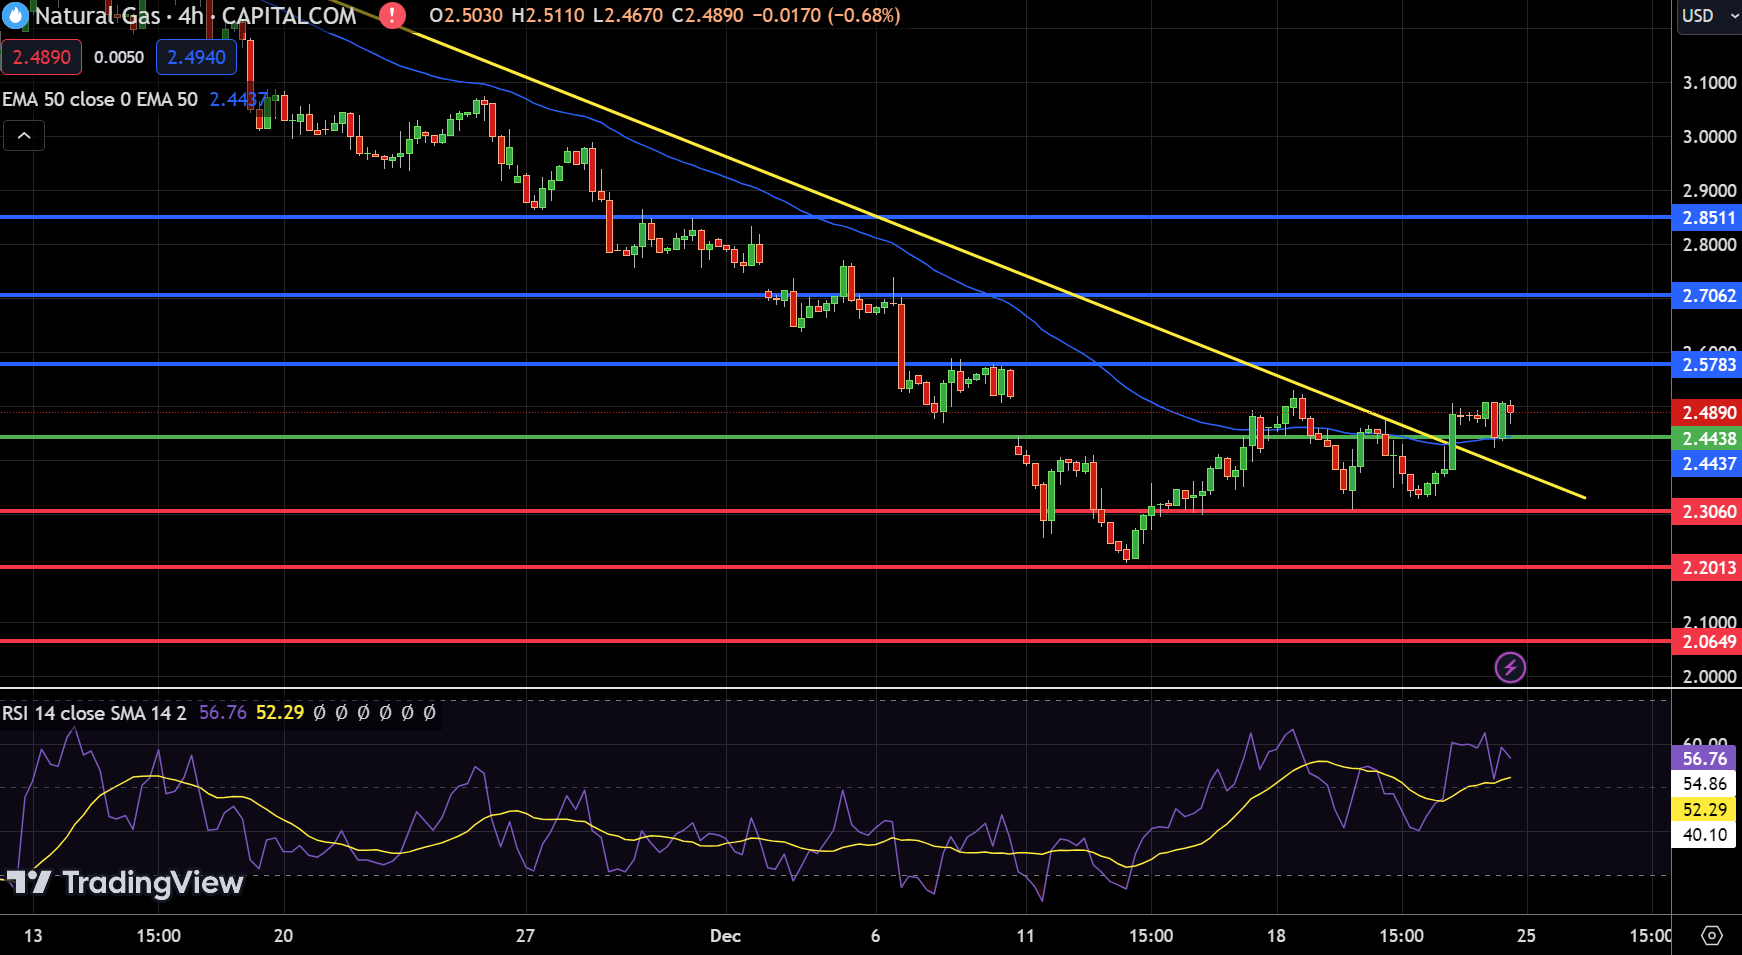
On December 25, Natural Gas (NG) presents a cautiously optimistic scenario in the commodities market, showing a modest increase of 0.30% to $2.489. This recent uptick places NG slightly above its pivot point at $2.44, indicating a potential shift towards bullish sentiment.
Immediate resistance levels are set at $2.58, $2.71, and $2.85, which could pose challenges for further upward movement. Conversely, NG finds support at $2.31, followed by lower levels at $2.20 and $2.06, crucial for stabilizing any downward trends.
Technical indicators provide a mixed yet hopeful outlook. The Relative Strength Index (RSI) at 56 suggests a leaning towards bullish sentiment, while the Moving Average Convergence Divergence (MACD) at 0.009 against a signal of 0.021 underscores a potential for upward momentum.
A noteworthy chart pattern is a downward trendline breakout at the $2.45 mark, further supporting the potential for a buying trend. The overall trend for NG appears bullish above the $2.45 level, pointing towards a possible testing of higher resistance levels in the short term.
WTI Oil Price Forecast
WTI Price Chart
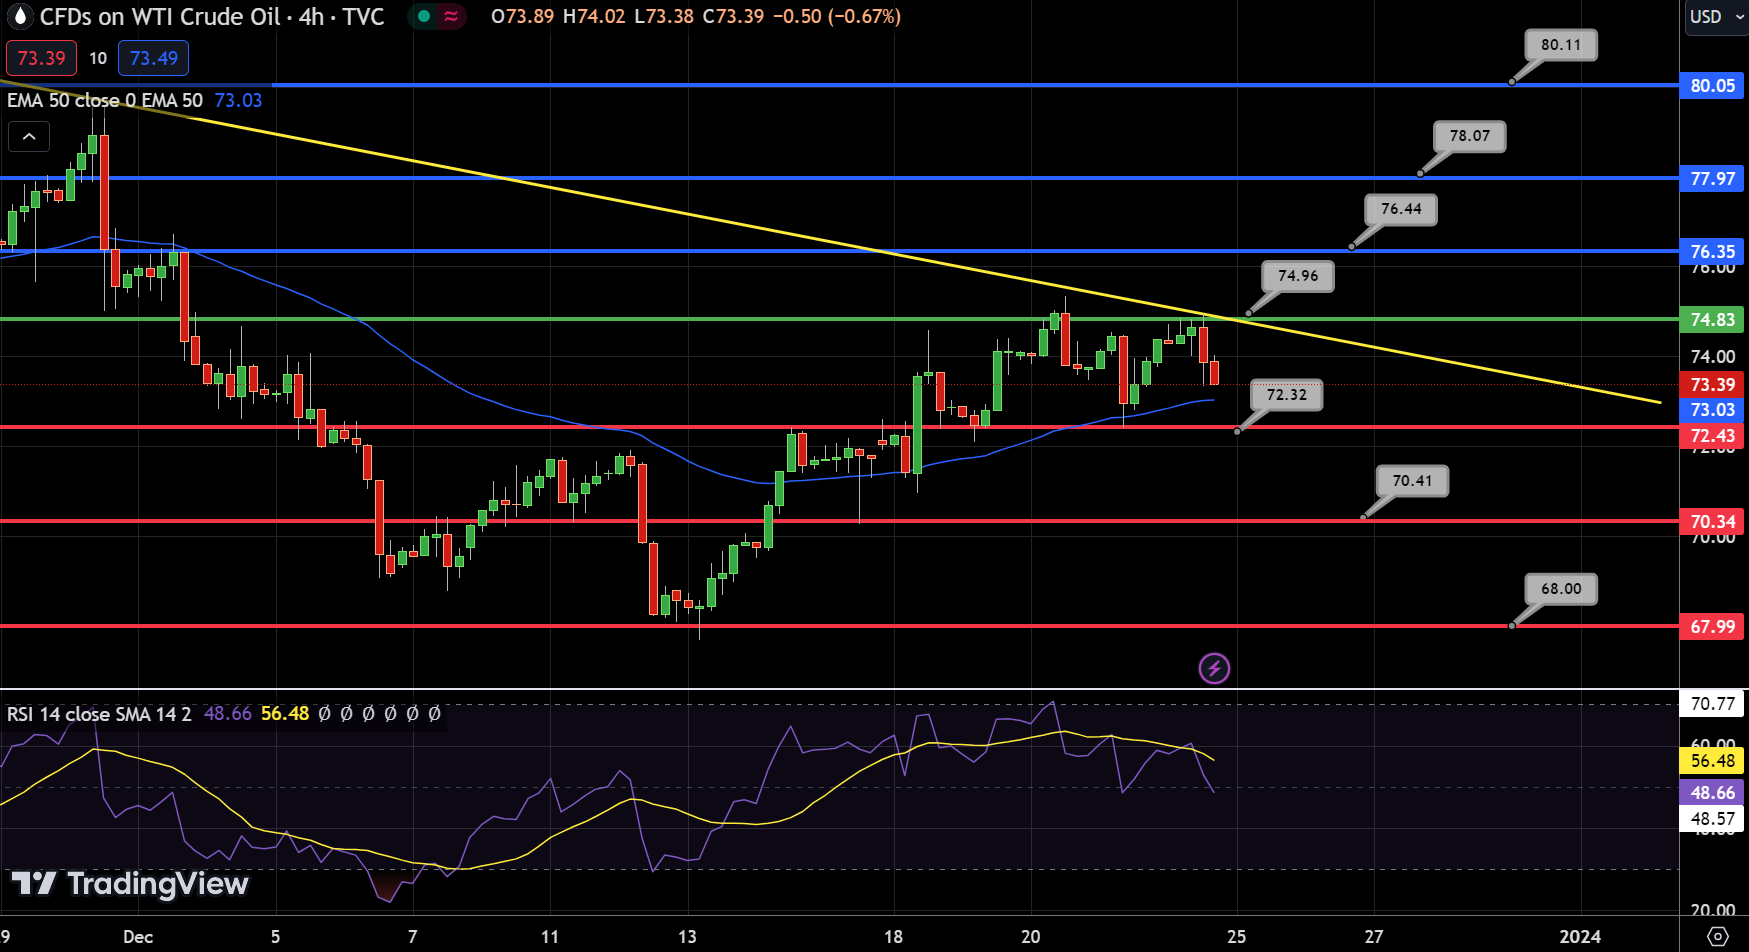
On December 25, USOIL exhibits a cautious market stance, marked by a 0.70% decline to $73.39. This movement situates USOIL below its pivotal point of $74.96, suggesting a bearish undertone. The oil market, characterized by its sensitivity to global economic cues, faces immediate resistance at $76.44, with further barriers at $78.07 and $80.11.
These levels are critical in determining USOIL’s potential upward trajectory. Support levels are established at $72.32, $70.41, and $68.00, providing a safety net against further price drops.
The Relative Strength Index (RSI) at 48 and the Moving Average Convergence Divergence (MACD) at -0.13, compared to a signal of 0.38, point to a bearish sentiment. The price’s position relative to the 50-Day Exponential Moving Average (EMA) of $73.03 further reinforces this bearish trend.
A noticeable downward trendline extending resistance at $75 adds to the market’s cautious outlook. The short-term forecast for USOIL remains bearish, particularly if it stays below the $75 mark.
Brent Oil Price Forecast
UKOIL Price Chart
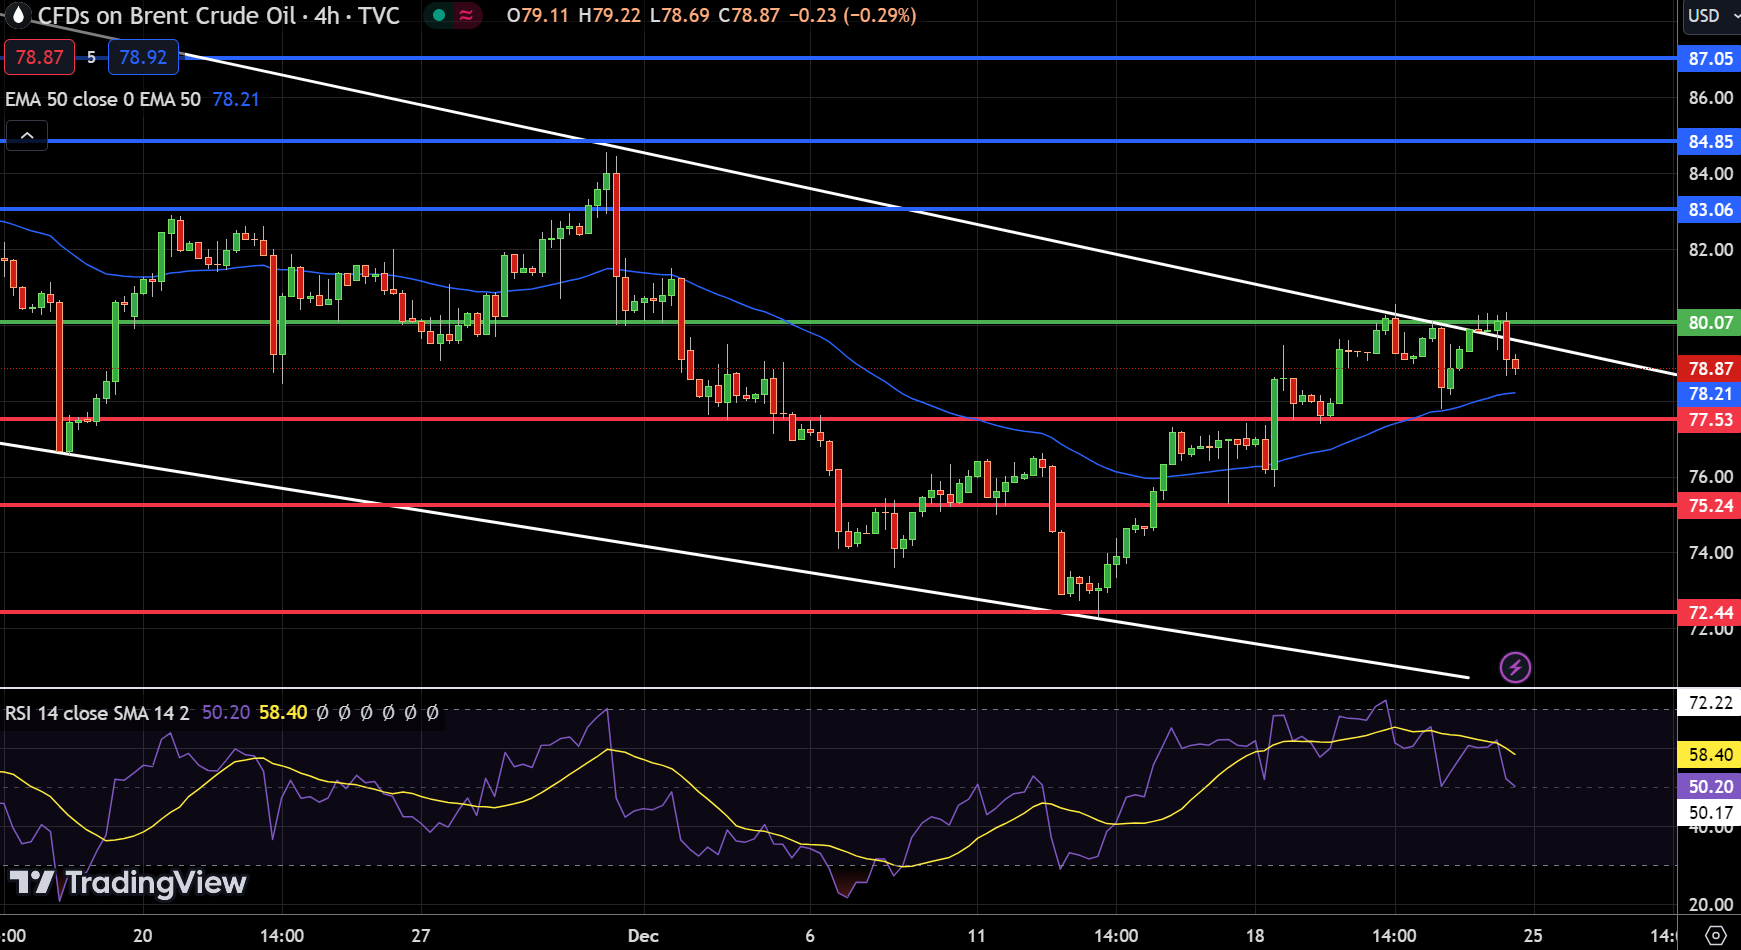
On December 25, UKOIL navigates a complex market terrain, reflecting a slight decline of 0.60%, positioning it at $78.87. The oil market, known for its volatility, currently hovers around a pivot point of $80.07, with crucial resistance levels looming at $83.06, $84.85, and $87.05.
These points mark significant barriers, potentially dictating the direction of future price movements. Conversely, immediate support is found at $77.53, followed by stronger levels at $75.24 and $72.44, which could provide a much-needed buffer against further price drops.
Technical indicators suggest a balanced yet cautious market sentiment. The Relative Strength Index (RSI) stands at 50, indicating a market equally weighted between bullish and bearish trends.
The Moving Average Convergence Divergence (MACD) at -0.150 against a signal of 0.470 hints at potential downward momentum. Moreover, the price’s proximity to the 50-Day Exponential Moving Average (EMA) of $78.21 adds to this cautious outlook.
A downward trendline extending resistance at $80 underscores the potential challenges facing the market. The overall trend for UKOIL is bearish below $80, indicating that a sustained drop below this level could lead to further declines.