
- Silver meets with a fresh supply following an intraday uptick to the $23.20 area on Friday.
- The technical setup favours bearish traders and supports prospects for a further downfall.
- Any attempted recovery move might continue to attract fresh sellers and remain capped.
Silver (XAG/USD) struggles to capitalize on its modest intraday gains to the $23.20 region and retreats to the lower end of its daily range during the early part of the European session. The white metal currently trades around the $23.00 mark and for now, seems to have stalled its modest recovery from a three-week low touched on Thursday.
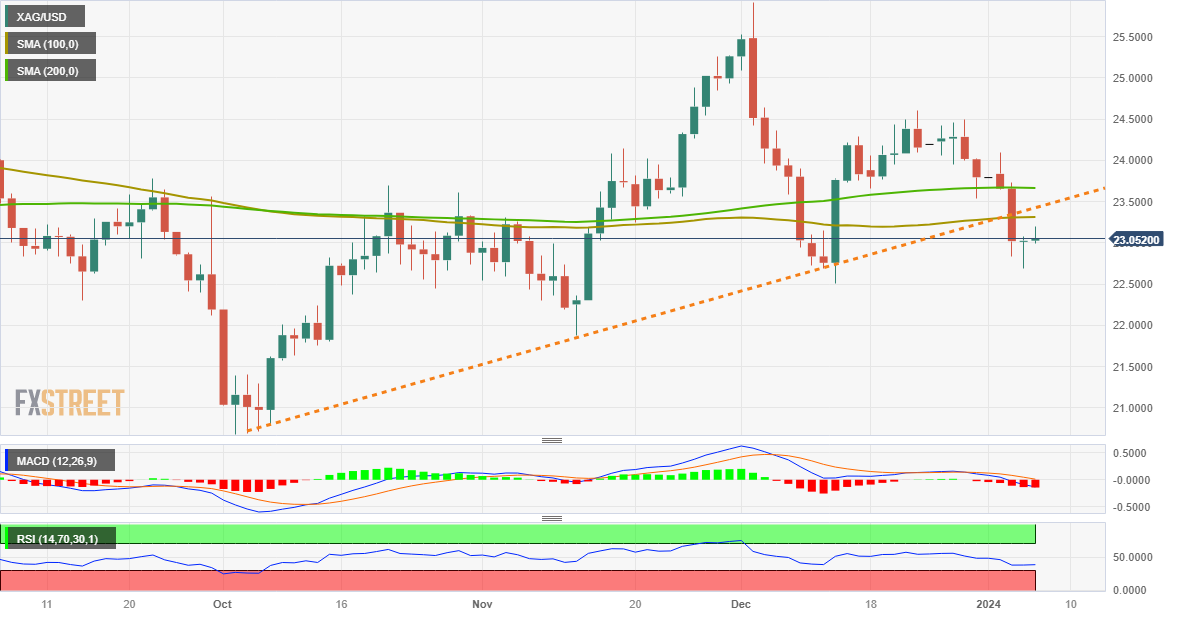
From a technical perspective, the recent sustained break below the very important 200-day Simple Moving Average (SMA) and a subsequent break through the $23.30 confluence was seen as a fresh trigger for bearish traders. Moreover, bearish oscillators on the daily chart are far from being in the oversold territory and suggest that the path of least resistance for the XAG/USD is to the downside.
That said, any further decline is more likely to find some support near the multi-week trough, around the $22.70 region set the previous day. Some follow-through selling, however, will reaffirm the negative bias and drag the XAG/USD further towards the December monthly swing low, around the mid-$22.00s, en route to the next relevant support near the $22.25 region and the $22.00 mark.
On the flip side, the aforementioned confluence support breakpoint around the $23.30 area, comprising the 100-day SMA and a multi-month-old ascending trend-line, might now act as an immediate strong barrier. Any further recovery could attract fresh sellers near the $23.55 zone and remain capped near the $23.80 horizontal barrier, which if cleared could lift the XAG/USD to the $24.00 mark.
Some follow-through buying will suggest that the recent corrective decline from the $24.60 region has run its course and push the XAG/USD further towards the $24.60 area (December 22 high). Bulls might eventually aim back towards reclaiming the $25.00 psychological mark.
Silver daily chart
Technical levels to watch
XAG/USD
| OVERVIEW | |
|---|---|
| Today last price | 23.06 |
| Today Daily Change | 0.04 |
| Today Daily Change % | 0.17 |
| Today daily open | 23.02 |
| TRENDS | |
|---|---|
| Daily SMA20 | 23.75 |
| Daily SMA50 | 23.66 |
| Daily SMA100 | 23.31 |
| Daily SMA200 | 23.67 |
| LEVELS | |
|---|---|
| Previous Daily High | 23.07 |
| Previous Daily Low | 22.69 |
| Previous Weekly High | 24.49 |
| Previous Weekly Low | 23.54 |
| Previous Monthly High | 25.92 |
| Previous Monthly Low | 22.51 |
| Daily Fibonacci 38.2% | 22.93 |
| Daily Fibonacci 61.8% | 22.84 |
| Daily Pivot Point S1 | 22.79 |
| Daily Pivot Point S2 | 22.55 |
| Daily Pivot Point S3 | 22.4 |
| Daily Pivot Point R1 | 23.17 |
| Daily Pivot Point R2 | 23.31 |
| Daily Pivot Point R3 | 23.55 |