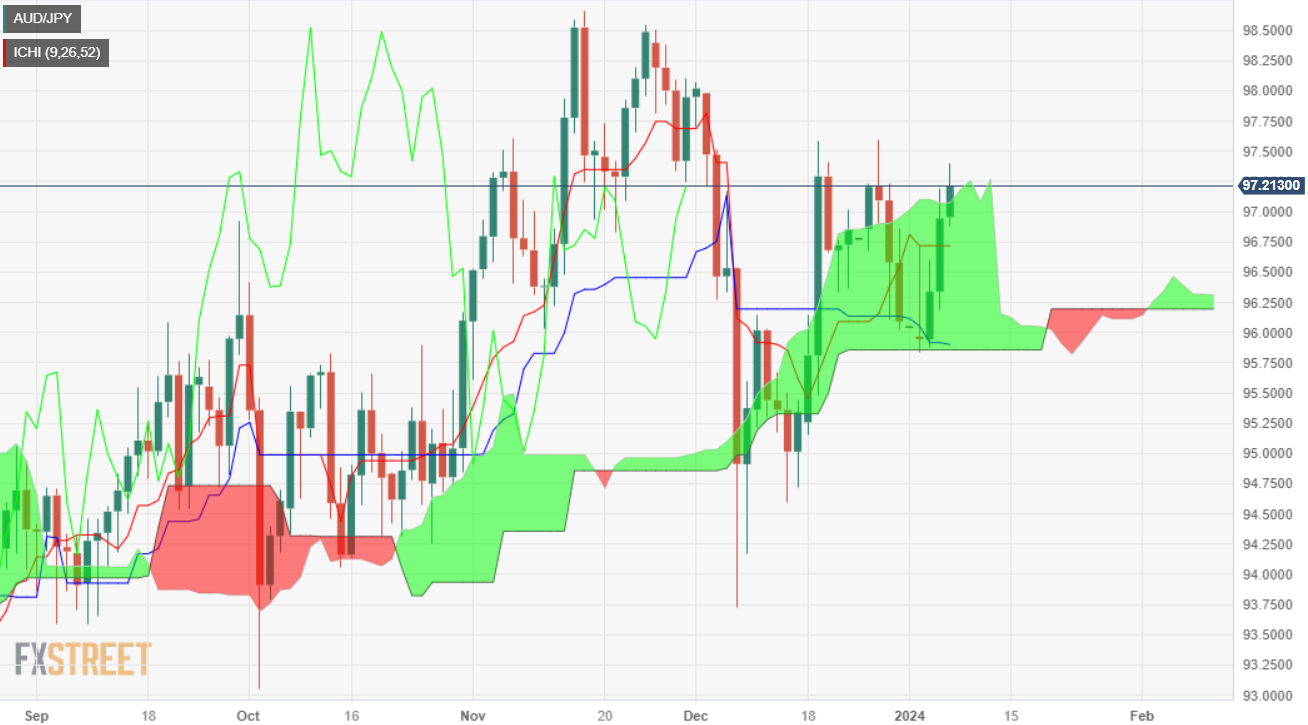
- AUD/JPY sees slight 0.24% increase, maintaining position near Ichimoku Cloud, signaling potential market shifts.
- For continued upward trajectory, the pair needs to breach December’s high of 97.59, eyeing 98.00 and last year’s peak at 98.58.
- Downside risks include support levels at 96.83, Tenkan-Sen at 96.71, and possible retreat to 95.90.
The AUD/JPY is set to finish the week with gains of close to 1.20%, though it remains at the brisk of getting back inside the Ichimoku Cloud (Kumo), which could pave the way for a pullback. At the time of writing, the pair trades at 97.20, posting modest gains of 0.24% after hitting a daily low of 96.83.
The cross rallied above the Kumo, opening the door for further upside, with buyers leaning on the top, with first support at 97.07. If buyers would like to drive prices higher, they need to reclaim December’s high of 97.59, which, once cleared, could pave the path toward 98.00. Once surpassed, up next would be last year’s high at 98.58.
On a bearish resumption, AUD/JPY sellers must drag prices below 97.00, toward the first support level seen at the November 21 low of 96.83. Once surpassed, the Tenkan-Sen would be up next at 96,71, followed by 96.18, January’s 4 swing low. If bulls could not cap the downtrend, the pair could retrace the current week’s gains and open the door for additional losses below the Kijun-Sen at 95.90.
AUD/JPY Price Action – Daily Chart

AUD/JPY Technical Levels
AUD/JPY
| OVERVIEW | |
|---|---|
| Today last price | 97.21 |
| Today Daily Change | 0.27 |
| Today Daily Change % | 0.28 |
| Today daily open | 96.94 |
| TRENDS | |
|---|---|
| Daily SMA20 | 96.25 |
| Daily SMA50 | 96.74 |
| Daily SMA100 | 95.74 |
| Daily SMA200 | 94.25 |
| LEVELS | |
|---|---|
| Previous Daily High | 97.2 |
| Previous Daily Low | 96.19 |
| Previous Weekly High | 97.6 |
| Previous Weekly Low | 96.03 |
| Previous Monthly High | 98.07 |
| Previous Monthly Low | 93.73 |
| Daily Fibonacci 38.2% | 96.81 |
| Daily Fibonacci 61.8% | 96.57 |
| Daily Pivot Point S1 | 96.36 |
| Daily Pivot Point S2 | 95.77 |
| Daily Pivot Point S3 | 95.35 |
| Daily Pivot Point R1 | 97.36 |
| Daily Pivot Point R2 | 97.78 |
| Daily Pivot Point R3 | 98.37 |

