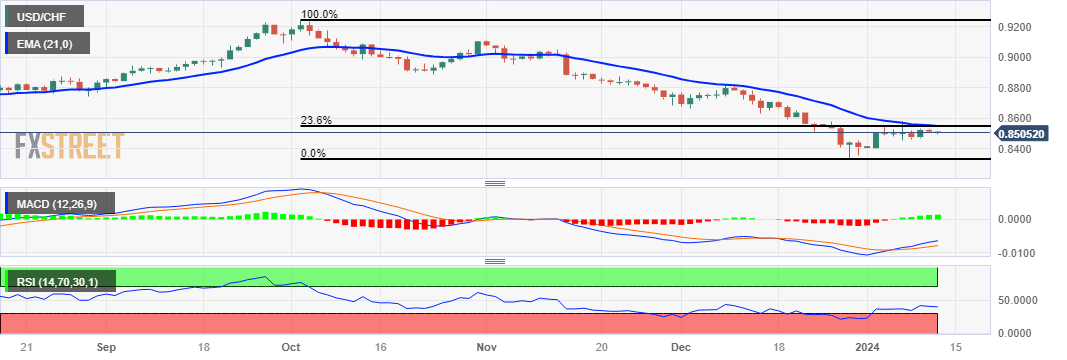
- USD/CHF faces challenges as investors price in the Fed rate cuts.
- MACD indicator suggests the subdued momentum in the pair.
- A fall below the 0.8500 level could lead the pair to revisit the weekly low at 0.8460.
USD/CHF moves on a downward trajectory for the second successive day, trading near 0.8510 during the European hours on Thursday. The USD/CHF pair encounters difficulties as investors shift their focus away from the US Dollar (USD), possibly due to speculation about five interest rate cuts by the Federal Reserve (Fed) in 2024.
The technical indicator 14-day Relative Strength Index (RSI) suggests a bearish market sentiment for the USD/CHF pair as it is positioned below 50. Moreover, the Moving Average Convergence Divergence (MACD) line, though positioned below the centreline lies above the signal line. This suggests a subdued momentum in the EUR/USD pair. Market participants would likely exercise caution and await confirmation from the lagging indicator.
The USD/CHF pair could break below the psychological support at 0.8500 followed by the weekly low at 0.8460 and a major support level at 0.8450. A break below the latter could push the USD/CHF pair to navigate the region around the key level at 0.8400.
On the upside, the 23.6% Fibonacci retracement level at 0.8547 aligned with the 21-exponential Moving Average (EMA) at 0.8549 could act as the immediate resistance zone. A breakthrough above the zone could lead the USD/CHF pair to explore the psychological region around the 0.8600 level.
USD/CHF: Daily Chart

USD/CHF: MORE TECHNICAL LEVELS
| OVERVIEW | |
|---|---|
| Today last price | 0.8504 |
| Today Daily Change | -0.0009 |
| Today Daily Change % | -0.11 |
| Today daily open | 0.8513 |
| TRENDS | |
|---|---|
| Daily SMA20 | 0.8536 |
| Daily SMA50 | 0.8727 |
| Daily SMA100 | 0.8861 |
| Daily SMA200 | 0.8877 |
| LEVELS | |
|---|---|
| Previous Daily High | 0.8535 |
| Previous Daily Low | 0.8508 |
| Previous Weekly High | 0.8578 |
| Previous Weekly Low | 0.8399 |
| Previous Monthly High | 0.8821 |
| Previous Monthly Low | 0.8333 |
| Daily Fibonacci 38.2% | 0.8518 |
| Daily Fibonacci 61.8% | 0.8525 |
| Daily Pivot Point S1 | 0.8502 |
| Daily Pivot Point S2 | 0.8491 |
| Daily Pivot Point S3 | 0.8474 |
| Daily Pivot Point R1 | 0.853 |
| Daily Pivot Point R2 | 0.8547 |
| Daily Pivot Point R3 | 0.8558 |

